
KPI & Metrics - From Data Capture to Crisp Insight

Capture KPIs once, eliminate spreadsheet-based reporting, and trust what you review.

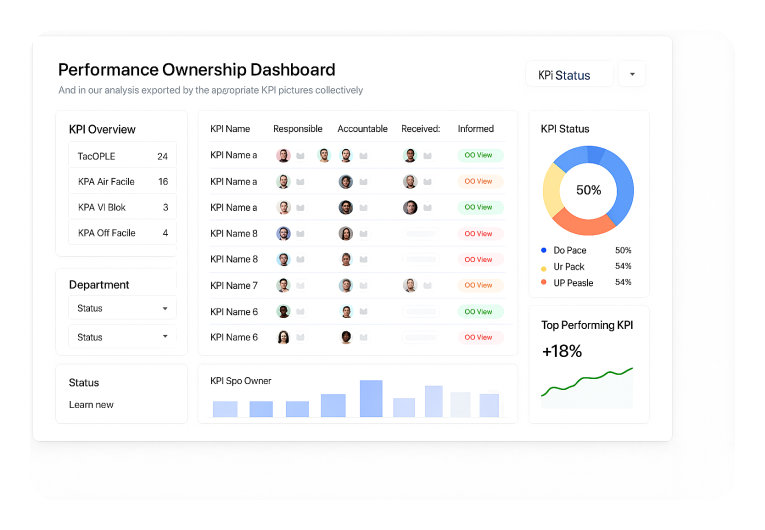
performance ownership dashboard

Spreadsheets Create Risk, Not Insight

Manual KPI tracking introduces delay, inconsistency, and blind spots.

Flexible KPI Capture for Real Operations

Presto PDCA allows KPIs to be captured through multiple channels, making it easy to fit into existing ways of working. Teams can upload KPI data via simple CSV files, feed results directly through the KPI Connect panel, or integrate KPIs automatically from ERP and operational systems.

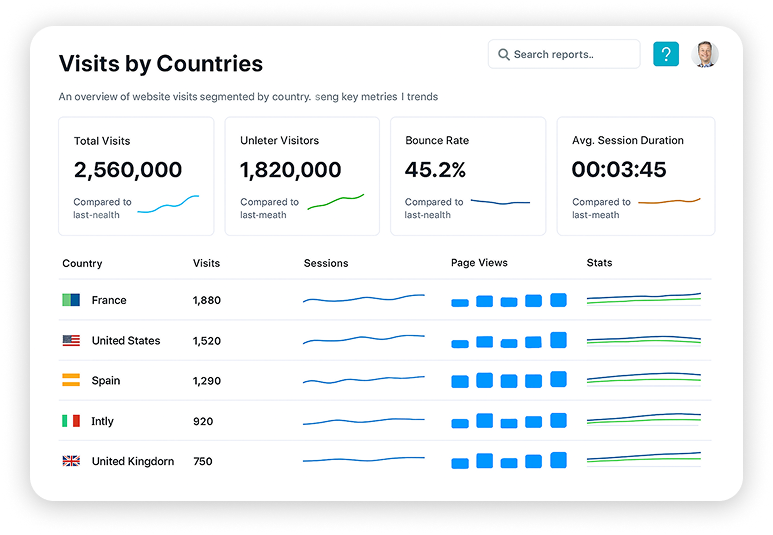
kpi data management

Low-Friction Input for Staff and Teams

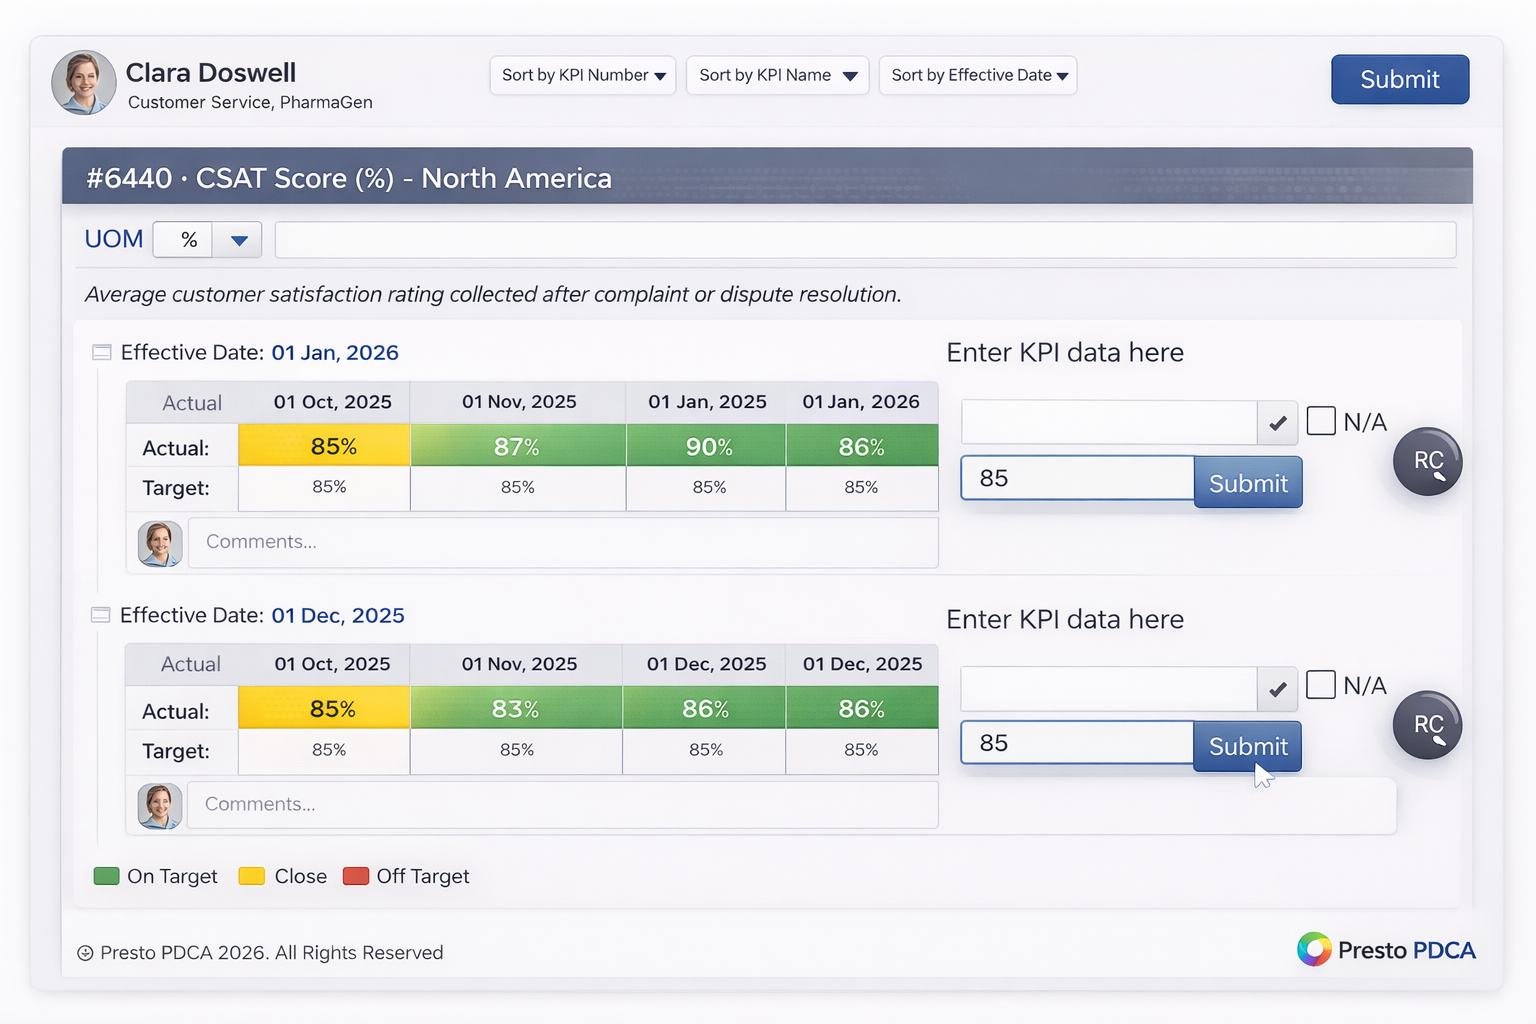
KPI Connect is a unique, game-changing input panel that allows staff to submit KPI results & issue root causes directly from a link delivered to their e-mail inbox. In just two taps, hundreds of staff from office teams to shop-floor workders can feed KPI data from any email-enabled device with minimal effort. No training required!

bowler chart updates

Eliminate Offline Tools Immediately

Once KPIs are captured in Presto PDCA, spreadsheets, email trackers, and side files are no longer needed. Results are stored once and reused across dashboards, charts, and reviews — removing manual consolidation and reducing the risk of errors or version conflicts.

eliminate offline tools

Report performance without rebuilding or reconciling data.

Reporting You Can Trust

KPIs are visualized using built-in charts including bowler, trend, Pareto, and standard graphs, all powered by the same captured data set.

Proven in Real Operations

What leaders say about managing performance with Presto PDCA

Dubai, United Arab Emirates

Shabbir Haideri, General Manager, Manufacturing

We removed dozens of spreadsheets and offline trackers within weeks of deploying Presto PDCA, instantly improving KPI reliability and management confidence.

Browse More

This is just the start, explore how you can optimise your workflow and increase revenue.

KPI Connect™ & Bowler Charts

KPI Connect™ & Bowler Charts

Automatically collect KPI updates and monitor performance using Bowler Charts, trends, Pareto analysis, root cause reporting, KPI commentary, and automated…

Strategy Deployment & Hoshin Kanri

Strategy Deployment & Hoshin Kanri

Connect strategic objectives to KPIs, initiatives, projects, and governance using Hoshin Kanri, Balanced Scorecard, and strategic governance reporting.

Organizational Structure & Role Management

Organizational Structure & Role Management

Manage organizational charts, departments, reporting lines, roles, competencies, and governance responsibilities from one interactive platform.

Get Started in Seconds

Get Started Image