
The Pareto Chart. Root Cause Insight, Built In

Capture root causes at source and focus leadership attention where it matters most.

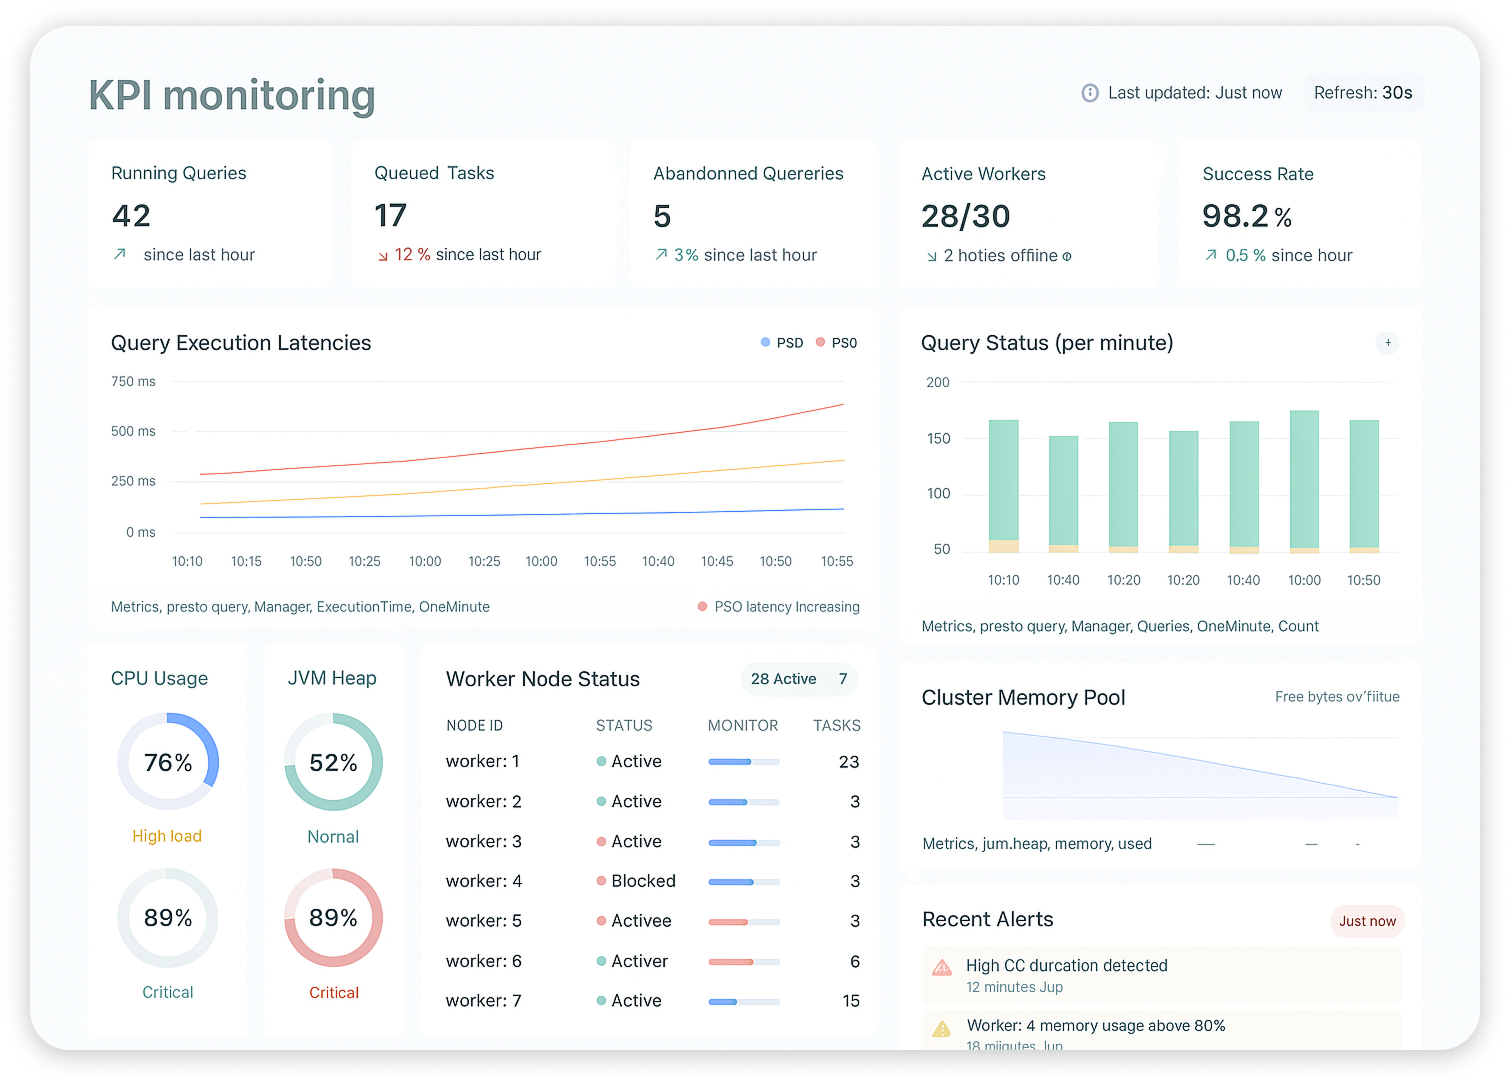
kpi monitoring

From KPI Updates to Immediate Insight

Understand what’s driving performance at the moment results are captured, not weeks later in meetings.

Capture Root Causes at Source

When KPI owners update results through the KPI Connect 2-way panel, they assign the root causes driving performance at the same time. Insight is captured once, in context, and without relying on memory.

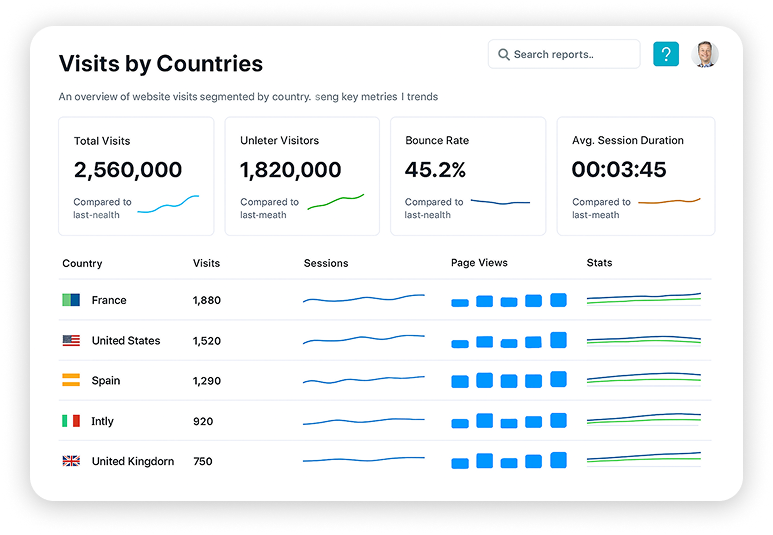
kpi data management

Instant Pareto Insight, Automatically Aggregated

Root cause data is automatically aggregated using Pareto logic, revealing the few causes responsible for most performance issues without additional analysis or preparation.

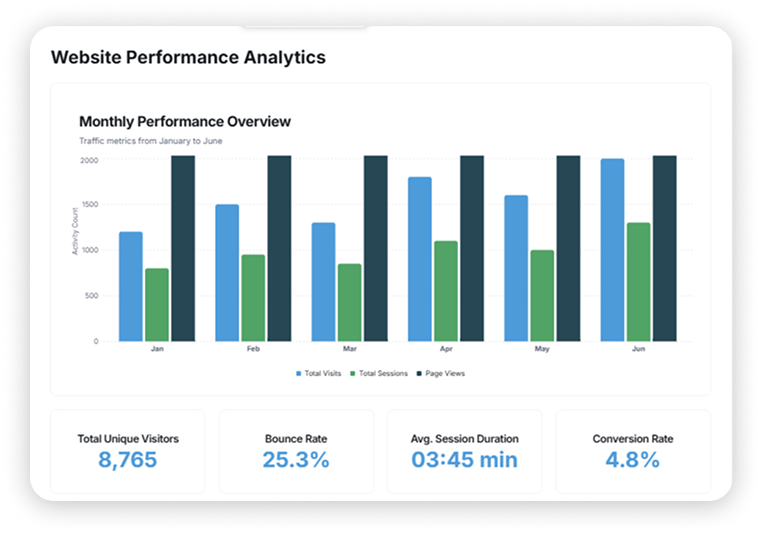
website performance icon

Explain KPI Deviations Where Reviews Already Happen

The Pareto Chart is fully integrated into the KPI Bowler Chart. With a single click, leaders can open a Pareto view directly from the Bowler to see root cause evidence for the selected period, right on the review screen.

eliminate offline tools

Root cause insight, exactly where decisions are made.

Clarity Without Complexity

By embedding Pareto insight directly into the KPI Bowler Chart, leaders can explain deviations instantly on the same report without extra analysis, navigation, or follow-up work.

Proven in Real Operations

How leaders use root cause insight to focus reviews and drive action

London, UK

CEO, Global Pharmaceutical Manufacturer

By adding root cause analysis to our weekly 'SQDCP Call', we established a single KPI rhythm that aligned over 150 users across 11 sites around the same performance conversations and priorities.

Browse More

This is just the start, explore how you can optimise your KPI & performance management program and increase efficiency.

Organizational Structure & Role Management

Organizational Structure & Role Management

Manage organizational charts, departments, reporting lines, roles, competencies, and governance responsibilities from one interactive platform.

Executive Dashboards & Reporting Console

Executive Dashboards & Reporting Console

Build executive dashboards once and automatically distribute reports through secure hyperlinks, scheduled reporting, and role-based dashboards.

KPI Connect™ & Bowler Charts

KPI Connect™ & Bowler Charts

Automatically collect KPI updates and monitor performance using Bowler Charts, trends, Pareto analysis, root cause reporting, KPI commentary, and automated…

Get Started in Seconds

Get Started Image